Sunday, December 28, 2008
Chart Make
So i made a few charts on Excel today, a pie chart, line chart, and a scatter chart.
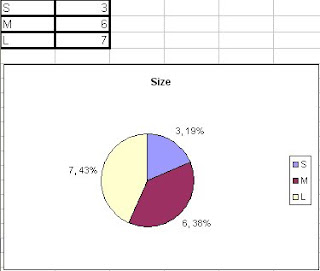
This is my pie chart. It shows how many kids wear different clothing sizes. It shows the percentage of each category: small, medium, and large.
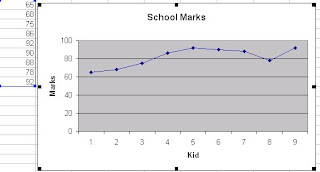
This is my line chart. It shows the marks of each kid after a test.
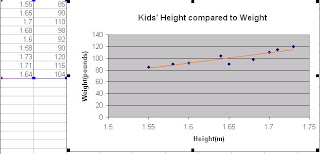
This is my scatter chart. It shows the relationship between the kids' height and weight.

# posted by P4 Andrew Hu @ 3:42 PM 
![]()
